Cavity Flow
Cavity Flow PIV Dataset
Download Link: http://mururoa.ethz.ch:5000/fbsharing/7mesML1u
Data Evaluation
The HDF5 data format can be read by almost any data analysis tool, sch as MATLAB (external page http://ch.mathworks.com/help/matlab/ref/hdf5read.html)
We prefer Python and developed the pyFlowStat module. It can be used to easily read and plot the PIV data. However, a sample MATLAB code is provided below.
The module is found here: external page https://github.com/ETH-BuildingPhysics/pyFlowStat
Make sure to install the Python HDF5 library: external page http://www.h5py.org/
If you don't have a python distribution installed already, the Anaconda distribution is a good place to start: external page http://continuum.io/downloads
It includes the editor Spyder, a programm similar to the MATLAB use interface.
Sample python code:
from pyFlowStat import SurfaceFunctions
from pyFlowStat import SurfacePlotter
import matplotlib.pyplot as plt
import h5py
hdf5filename=r'Cavity2D_Spire05m_TR600Hz.h5'
h5file=h5py.File(hdf5filename)
#To load all frames, uncomment these two lines
#slist=SurfaceFunctions.loadSurfaceList_hdf5(hdf5filename,keyrange='full',createDict=False)
#s0=slits[0]
#To load one frame
s0=SurfaceFunctions.loadSurface_hdf5(h5file,0,keyrange='full')
h5file.close()
fig=plt.figure()
ax=plt.subplot(1,1,1)
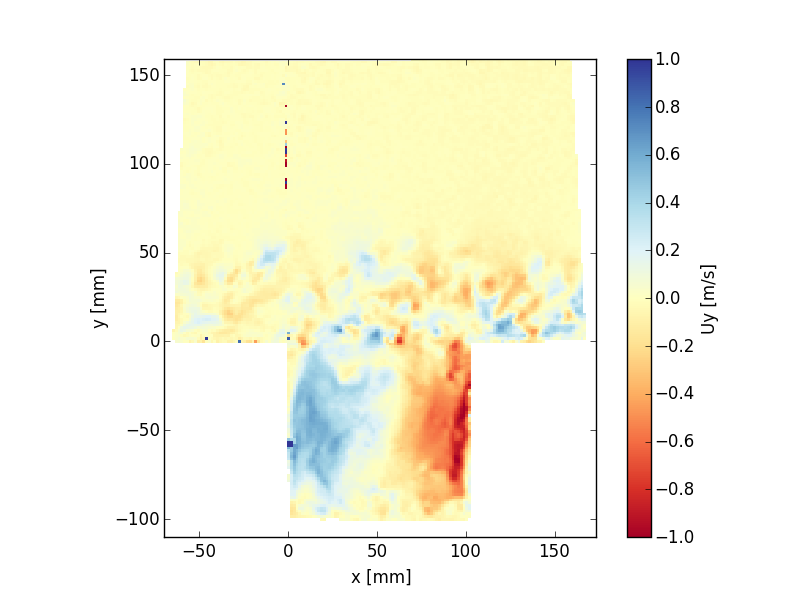
im=SurfacePlotter.PlotField(ax,s0,'Uy',vmin=-1.0,vmax=1.0,cmap='RdYlBu')
cb=plt.colorbar(im)
cb.set_label('Uy [m/s]')
ax.set_xlabel('x [mm]')
ax.set_ylabel('y [mm]')
plt.show()
Sample minimal MATLAB code. Note: MATLABs pcolor plots the center of the piv pixel and interpolates the color inbetween):
hdf5filename=r'Cavity2D_Spire05m_TR600Hz.h5'
data=h5read(hdf5filename,'/Surface0/vy')
dim=h5read(hdf5filename,'/Surface0/dim')
minX=dim(1)
minY=dim(2)
maxX=dim(3)
maxY=dim(4)
dx=h5read(hdf5filename,'/Surface0/dx')
ysteps=round((maxY-minY)/dx)+1
xsteps=round((maxX-minX)/dx)+1
yrange=linspace(minY,maxY,ysteps)
yrange=fliplr(yrange)
xrange = linspace(minX,maxX,xsteps)
[X,Y]=meshgrid(xrange, yrange)
pcolor(X,Y,data')
colormap('jet')
shading flat
axis equal tight